Program Details

Data Visualization
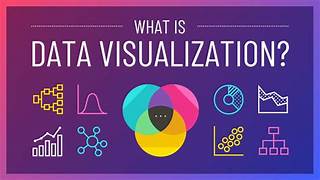
Data visualization is a powerful tool that transforms raw data into graphical representations, making complex information more accessible and understandable. By using charts, graphs, maps, and other visual formats, data visualization helps identify patterns, trends, and outliers that might not be immediately evident from numerical data alone
What You Learn
> Basic Principles of Design
> LOOPS
> Types of Visualizations
> Tools and Software
> Data Preparation
> Creating Effective Visualizations
> Interactivity and Dashboards
> Ethics and Best Practices
> Case Studies and Real-World Projects